
Hunts Point, WA October 2025 Housing Market
September 2025 was a Neutral market! The number of for sale listings was down 20% from one year earlier and down 33.3% from the previous month. The number of sold listings decreased 100% year over year and decreased 100% month over month. The number of under contract listings was 2 and up 100% compared to previous year. The Months of Inventory based on Closed Sales was 4, up 138% from the previous year.
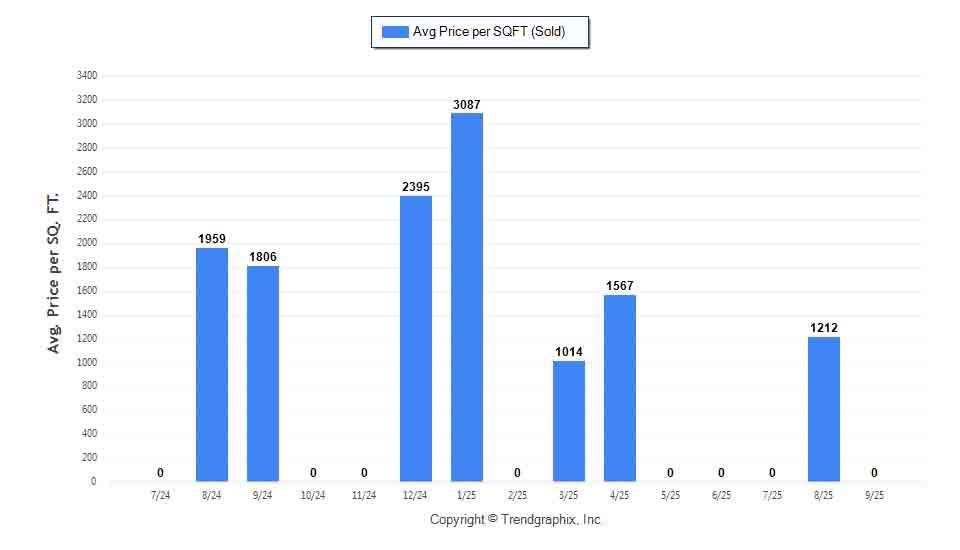
The Average Sold Price per Square Footage was down 100% compared to previous month and down 100% compared to last year. The Median Sold Price decreased by 100% from last month. The Average Sold Price also decreased by 100% from last month. Based on the 6 month trend, the Average Sold Price trend was "Depreciating" and the Median Sold Price trend was "Depreciating".
The Average Days on Market showed a neutral trend, a decrease of 100% compared to previous year. The ratio of Sold Price vs. Original List Price was 0%, a decrease of 100% compared to previous year.
Video edited on Kapwing
It was a Neutral Market
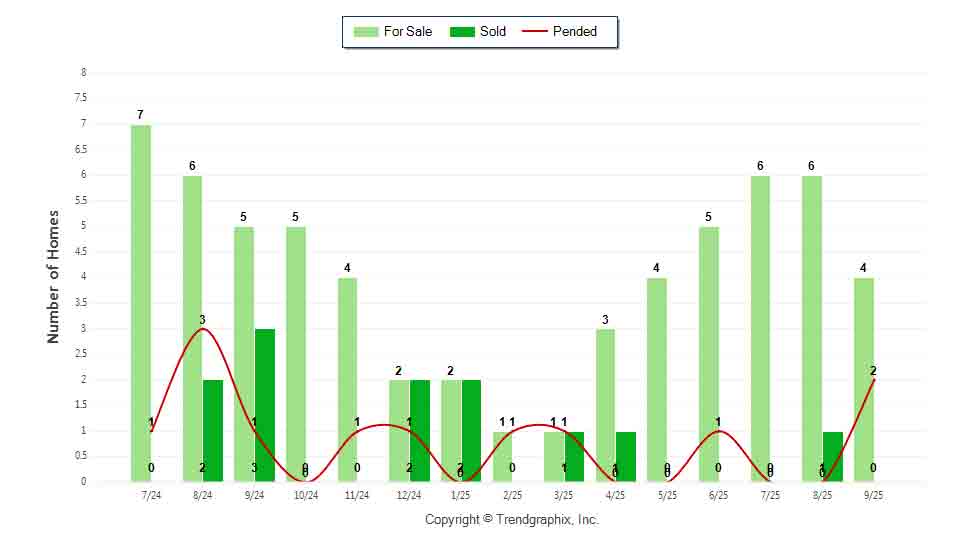
Property Sales (Sold)
September property sales were 0, down 100% from 3 in September of 2024 and 100% lower than the 1 sales last month.
Current Inventory (For Sale)
Versus last year, the total number of properties available this month was lower by 1 units of 20%. This year's smaller inventory means that buyers who waited to buy may have smaller selection to choose from. The number of current inventory was down 33.3% compared to the previous month.
Property Under Contract (Pended)
The total number of homes pended in month was 2. This month's pended property sales were 100% higher than at this time last year.
All reports are published October 2025, based on data available at the end of September 2025, except for the today’s stats. Information and statistics derived from Northwest Multiple Listing Service. Neither the Board or its MLS guarantees or is in any way responsible for its accuracy. Data maintained by the Board or its MLS may not reflect all real estate activity in the market. Report reflects activity by all brokers participated in the MLS.
The Average Sold Price per Square Footage was Depreciating*
The Average Sold Price per Square Footage is a great indicator for the direction of property values. Since Median Sold Price and Average Sold Price can be impacted by the 'mix' of high or low end properties in the market, the Average Sold Price per Square Footage is a more normalized indicator on the direction of property values. The September 2025 Average Sold Price per Square Footage of $0 was down 100% from $1,212 last month and down 100% from $1,806 in September of last year.
* Based on 6 month trend – Appreciating/Depreciating/Neutral
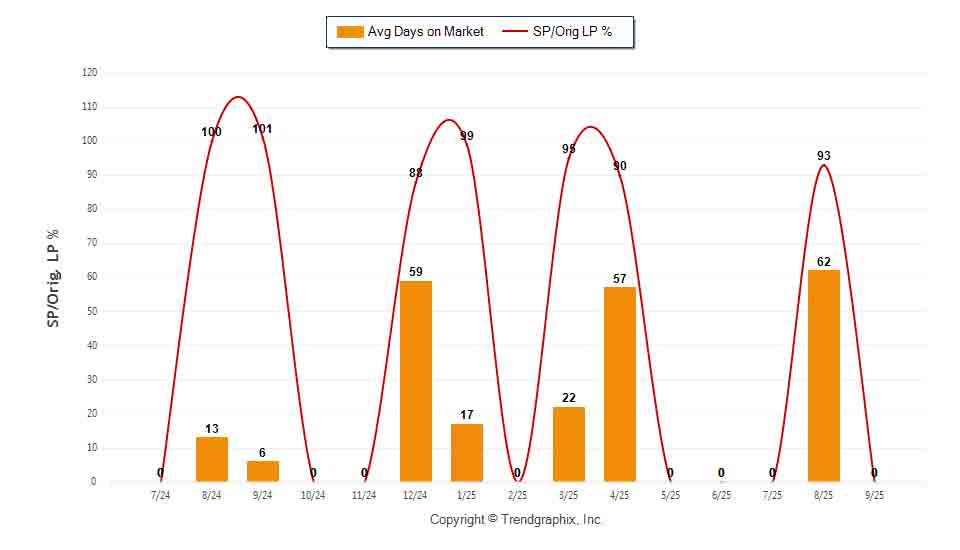
The Days on Market Showed Neutral Trend*
The average Days on Market (DOM) shows how many days the average property is on the market before it sells. An upward trend in DOM trends to indicate a move towards more of a Buyer’s market, a downward trend indicates a move towards more of a Seller’s market. The DOM for September 2025 was 0, down 100% from 62 days last month and down 100% from 6 days in September of last year.
The Sold/Original List Price Ratio Remains Steady**
The Sold Price vs. Original List Price reveals the average amount that sellers are agreeing to come down from their original list price. The lower the ratio is below 100% the more of a Buyer’s market exists, a ratio at or above 100% indicates more of a Seller’s market. This month Sold Price vs. Original List Price of 0% was down 100% % from last month and down from 100% % in September of last year.
* Based on 6 month trend – Upward/Downward/Neutral
** Based on 6 month trend – Rising/Falling/Remains Steady
All reports are published October 2025, based on data available at the end of September 2025, except for the today’s stats. Information and statistics derived from Northwest Multiple Listing Service. Neither the Board or its MLS guarantees or is in any way responsible for its accuracy. Data maintained by the Board or its MLS may not reflect all real estate activity in the market. Report reflects activity by all brokers participated in the MLS.
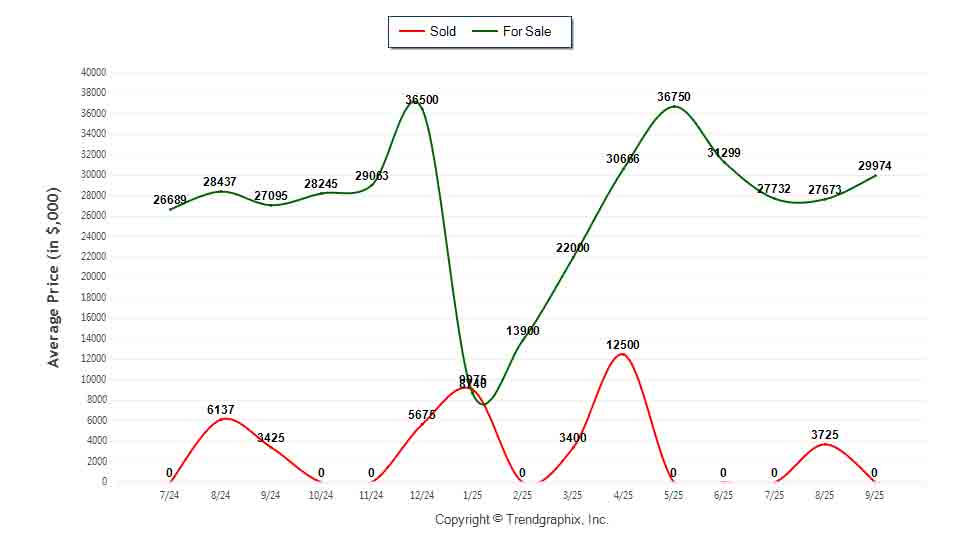
The Average For Sale Price was Neutral*
The Average For Sale Price in September was $29,974,000, up 10.6% from $27,095,000 in September of 2024 and up 8.3% from $27,673,000 last month.
The Average Sold Price was Depreciating*
The Average Sold Price in September was $0,000, down 100% from $3,425,000 in September of 2024 and down 100% from $3,725,000 last month.
The Median Sold Price was Depreciating*
The Median Sold Price in September was $0,000, down 100% from $2,925,000 in September of 2024 and down 100% from $3,725,000 last month.
* Based on 6 month trend – Appreciating/Depreciating/Neutral
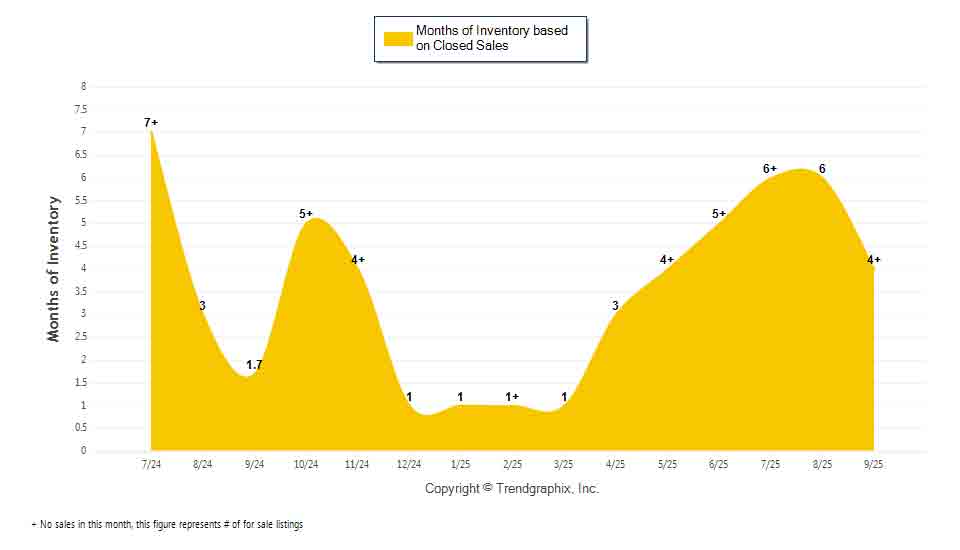
It was a Neutral Market*
A comparatively lower Months of Inventory is more beneficial for sellers while a higher months of inventory is better for buyers.
*Buyer’s market: more than 6 months of inventory
Seller’s market: less than 3 months of inventory
Neutral market: 3 – 6 months of inventory
Months of Inventory based on Closed Sales
The September 2025 Months of Inventory based on Closed Sales of 4 was increased by 138% compared to last year and down 33.3% compared to last month. September 2025 was Neutral market.
Months of Inventory based on Pended Sales
The September 2025 Months of Inventory based on Pended Sales of 2 was decreased by 60% compared to last year and down 66.7% compared to last month. September 2025 was Seller's market.
All reports are published October 2025, based on data available at the end of September 2025, except for the today’s stats. Information and statistics derived from Northwest Multiple Listing Service. Neither the Board or its MLS guarantees or is in any way responsible for its accuracy. Data maintained by the Board or its MLS may not reflect all real estate activity in the market. Report reflects activity by all brokers participated in the MLS.
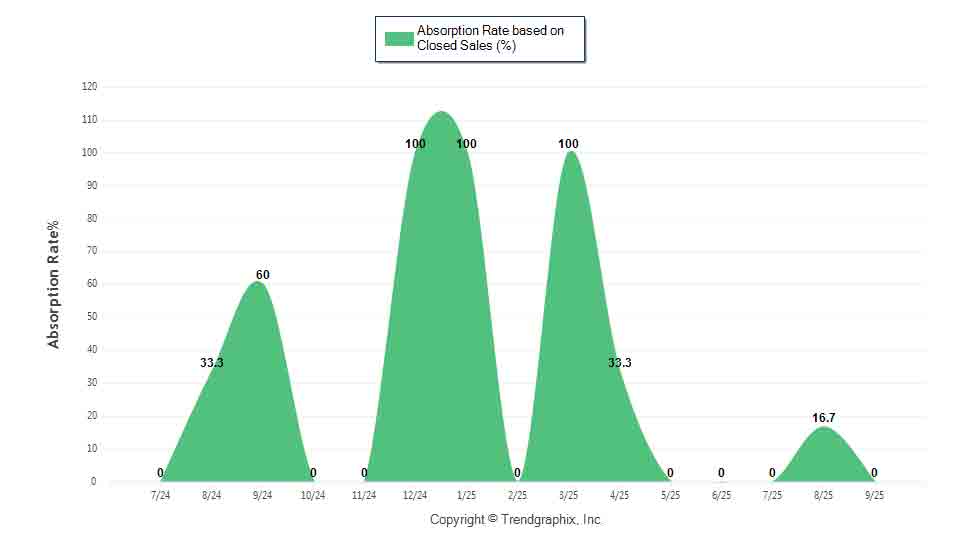
It was a Buyer's Market*
Absorption Rate measures the inverse of Months of Inventory and represents how much of the current active listings (as a percentage) are being absorbed each month.
*Buyer’s market: 16.67% and below
Seller’s market: 33.33% and above
Neutral market: 16.67% - 33.33%
Absorption Rate based on Closed Sales
The September 2025 Absorption Rate based on Closed Sales of 0 was decreased by 100% compared to last year and down 100.2% compared to last month.
Absorption Rate based on Pended Sales
The September 2025 Absorption Rate based on Pended Sales of 50 was increased by 150% compared to last year and the same compared to last month.
All reports are published October 2025, based on data available at the end of September 2025, except for the today’s stats. Information and statistics derived from Northwest Multiple Listing Service. Neither the Board or its MLS guarantees or is in any way responsible for its accuracy. Data maintained by the Board or its MLS may not reflect all real estate activity in the market. Report reflects activity by all brokers participated in the MLS.


©Copyright 1998-2025. All Rights Reserved